Kubernetes cluster monitoring tools
Contents
Kubernetes has container monitoring functions as well as the ability to restart, stop and replace failed containers. With the right tools, we can effortlessly work with containers without having to switch to previous versions. Container management tools are reaching maturity and this is linked to the evolution of DevOps processes.
In this post you will know more about various free of cost open source kubernetes monitoring tools, monitoring tools for kubernetes container, security & other log monitoring tools for 2024.
The open-source platform also includes Kubernetes container monitoring tools which can also be used to manage containers.
Some vendors, such as Oracle, IBM, Red Hat with OpenShift and CoreOS and Canonical (especially in association with its DevOps tool, Juju), have integrated Kubernetes into their offering.
Most public cloud platforms have container orchestration services, and Kubernetes is one of the most prominent at present. AWS offers Elastic Container Service and EKS. For its part, Microsoft provides Azure Container Service and Google, its Kubernetes Engine. This post covers the monitoring tools that Kubernetes uses.
Why do we need monitoring tools for Kubernetes?
Kubernetes monitoring tools gives you insight into your cluster’s, including performance metrics, resource counts and a top-level overview of what is happening inside your Kubernetes cluster.
In the cloud world, DevOPS is increasingly used to automate application deployments.
The primary goal of Kubernetes is to be able to deploy a complete infrastructure of an application in just a few clicks, in parallel, or as a replacement for a previous deployment.
In addition, Kubernetes makes it possible to manage the scaling of this infrastructure and therefore, to optimize the rendering for the end-user when visiting the application.
When you template a Kubernetes script in YAML, you can tell it depending on the performance of the node or pod in question: scale it horizontally or on another server.
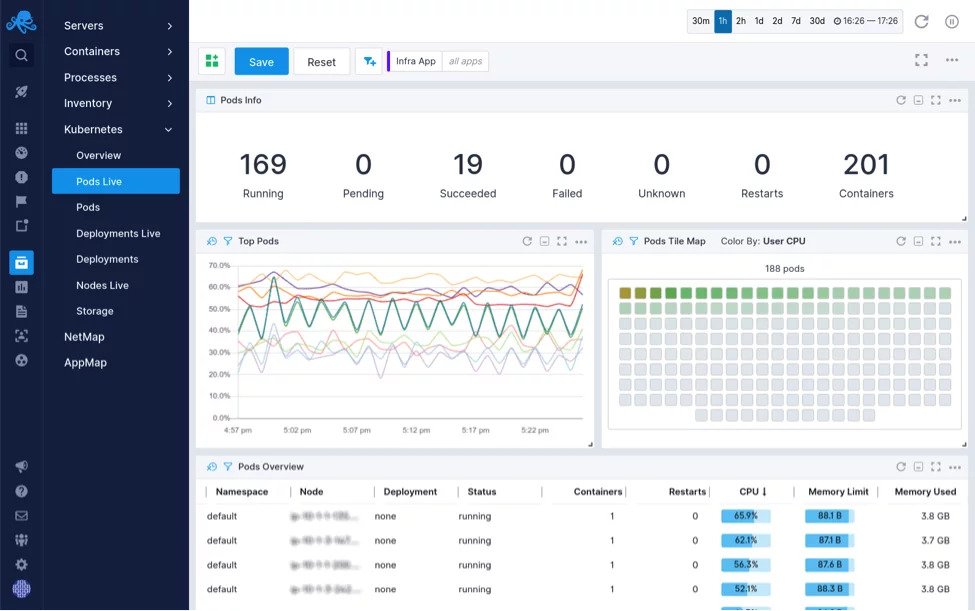
Which Kubernetes Metrics You Need to Monitor?
Monitoring Kubernetes involves measuring the cluster, all nodes, as well as monitoring pods, deployments, and services.
Kubernetes cluster metrics – First, you need to monitor the working of your entire Kubernetes cluster. This will help you know how many resources your entire cluster is using. How many applications are running on each node, and with what capacity nodes are functioning?
Here are some of the most useful metrics:
-
- Automatic container detection
- Automatic detection of all containers and container flows
- Using automatic Docker attributes and Docker perspectives
- Container health monitoring
- Monitoring container health and performance
- Obtain predictive insights and generate alerts on container performance
- Host performance monitoring
- Obtaining Host-Level Performance Metrics (SystemEdge)
- Continuous monitoring and optimization of all host servers
- Triage and diagnosis
- Automatically detect and isolate problems in the appropriate application levels
- Reduced Root Cause Analysis Time with Assisted Triage DX APM
Kubernetes pod metrics – Pod-level monitoring involves examining three types of metrics: Kubernetes metrics, container metrics, and application metrics.
Container measurements – Container metrics help you determine how close you are to the limits you have configured. You want to monitor metrics such as CPU, memory, and network usage. They also allow you to detect containers stuck in a CrashLoopBackoff.

Application metrics – It measures the performance and availability of the applications running in your Kubernetes cluster and are typically exposed by the applications themselves.
The metrics available depend on the business scope of each application. Suppose you are using a database application, you will probably be interested in data on tables, relationships, and index status. If you’re working with an eCommerce app, for example, you’ll want to keep an eye on the number of users online.
Monitoring, Analysis, and Remediation
Here are the functions that a Kubernetes container orchestrator contains:
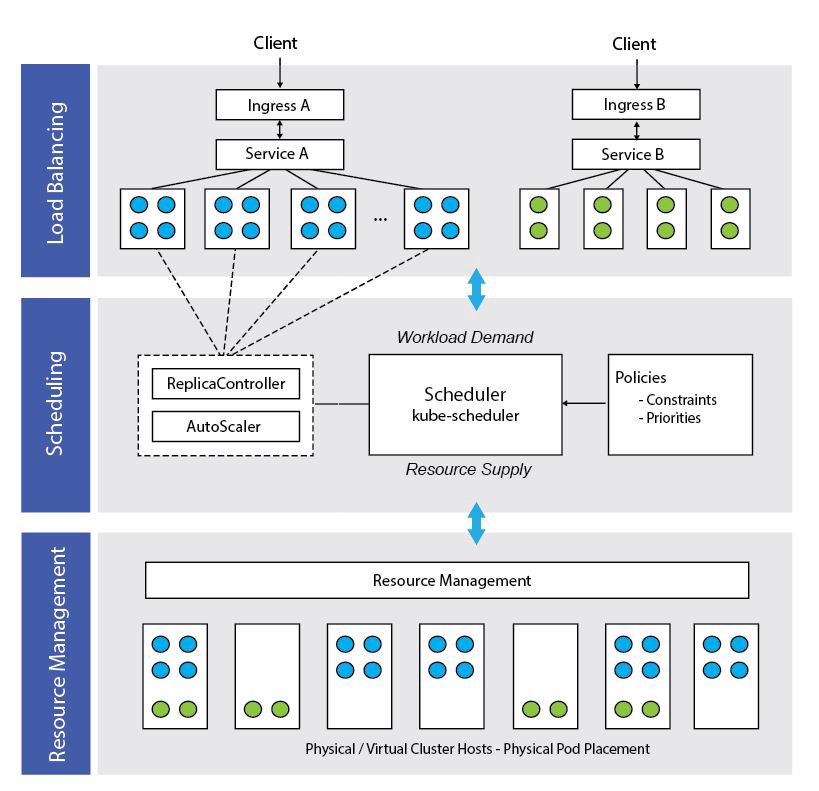
- Monitoring: The orchestrator must allow users to check if the containers are operating within the limits of the agreed policy. This type of monitoring data should be presented in an easy-to-read form, preferably through a graphical interface.
- Automation: Orchestrators should be able to consistently and repeatedly provision / deliver containers on different platforms as needed.
- Remediation: this is the ability to stop, restart, and replace containers that operate outside the limits of the agreed policy.
- Root cause analysis: container monitoring helps identify a problem. “Containerized” systems are complex, so tools that quickly identify the source of the problem are in demand.
- Integration into other systems: containerization is the downstream part of a complete DevOps process. The orchestration system must therefore work with the company’s DevOps toolset.
- System cleanup: While monitoring the health and compliance of containers, an orchestrator must also identify zombies, that is, unused containers that are still operational. It can either alert the administrators or stop the containers if necessary.
Take advantage of these Kubernetes tools to simplify application definitions, improve monitoring, facilitate cloud deployments, and more.
Top 18 Open Source Monitoring Tools for Kubernetes
Kubernetes has become a standard way – many would say the standard way – to deploy containerized applications at scale. But, if Kubernetes is helping us tame sprawling and complex container deployments, what do we have left to tame Kubernetes? This too can be complex, messy and difficult to manage.
As Kubernetes grows and evolves, it’s likely that some of its excesses will be tamed from within. But, some people don’t expect Kubernetes to be easier to use and have come up with their own solutions to many common Kubernetes issues in production.
We’re going to talk about the best Monitoring Tools that simplify Kubernetes in different ways: from simplifying command-line interactions, simplifying application deployment syntax, integrating with AWS, to creating a window in multiple clusters.
DataDog: Monitoring, Security and Analytics
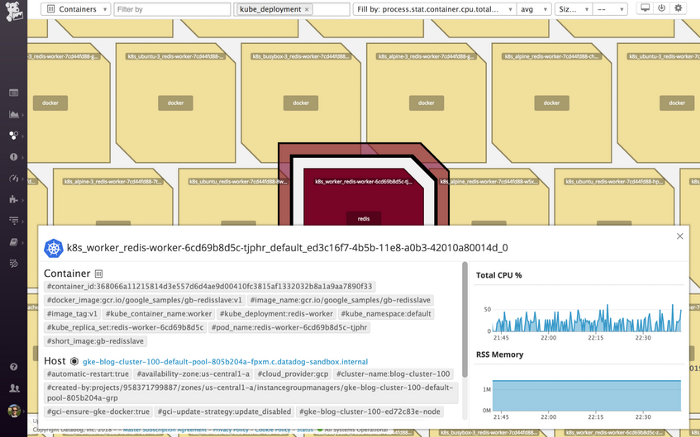
A paid Kubernetes security monitoring tool, Datadog to solve your monitoring issues and also offers an APM (Application Performance Management) solution to analyze your applications. It can therefore replace a product like AppDynamics by doing code introspection to show you the time spent in each of your functions.
One of its strengths is participatory management of information analysis, each member can comment on a diagram (or part) to keep track or to discuss a possible problem.
For example, if you notice an increase in the load of one of your applications, you can launch a debate directly on Datadog instead of sending a screenshot by email, think about who to copy.
It offers a wide choice of technologies to monitor all your applications and infrastructure.
Prometheus: Leading Open-Source Tool for Monitoring Kubernetes
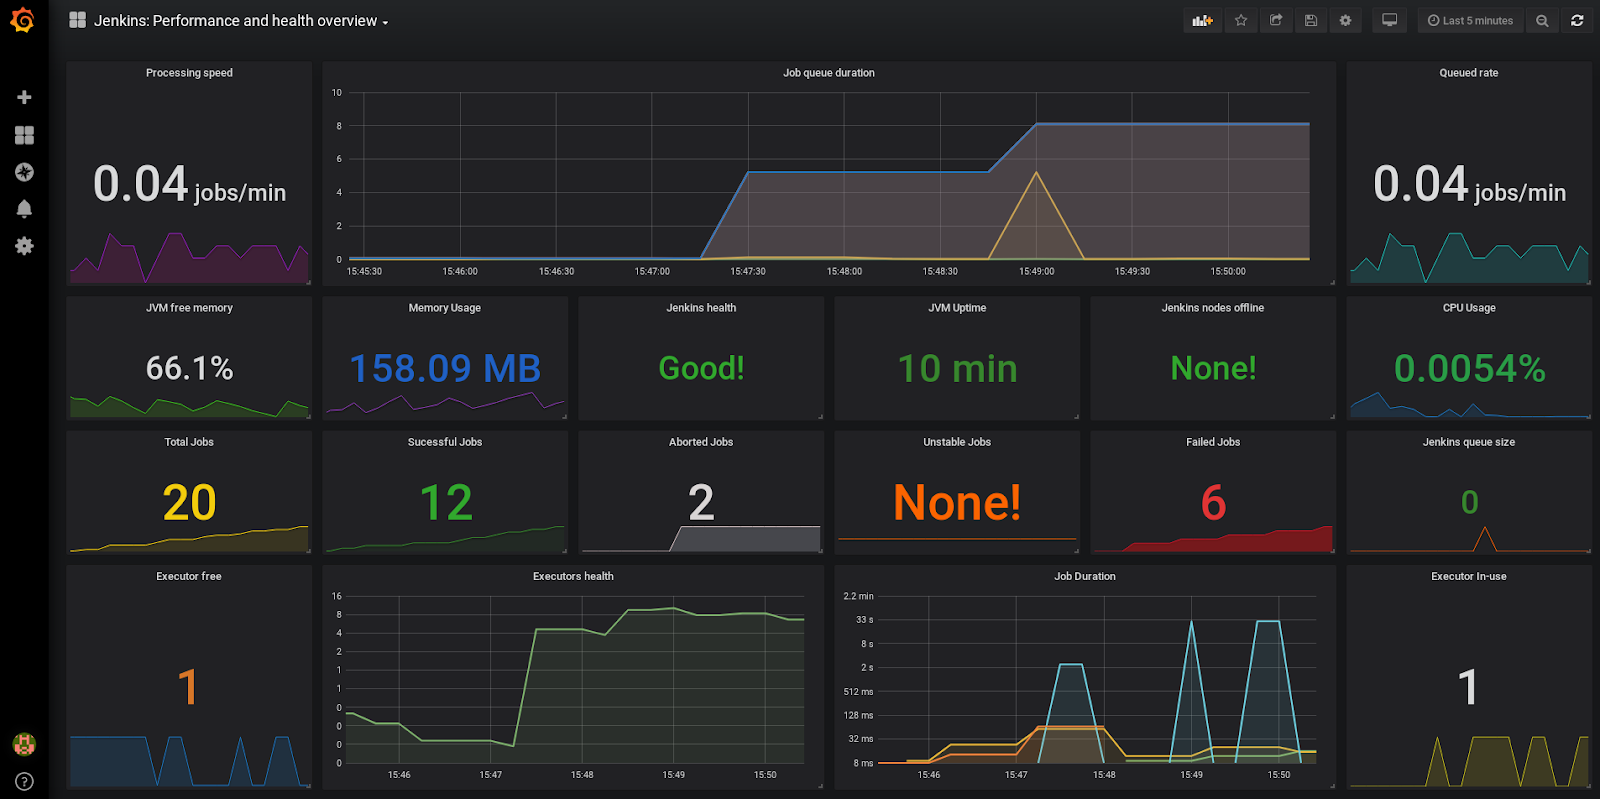
A free solution that offers many tools for managing your metrics.
Prometheus does not (or very little) manage the display of data, the interface is very simplistic and can only be used to learn the use of its APIs. It, therefore, requires the addition of an interface to be usable.
Prometheus’ recommendation is also not to store data beyond the default maximum time: 15 days. Unless you do not respect this recommendation, you will therefore also need to provide a base for storing this data. A good question to ask yourself then is: what data do I need beyond this threshold?
- Deployment
Prometheus can be fully deployed on your Kubernetes cluster. You can use all the containers on the quay.io or DockerHub site.
There are many examples of Kubernetes “Deployment” on the internet, the idea is to use an associated “ConfigMap” to deploy the configuration file. Adding a “Service” will allow access inside or outside your cluster.
Must Read – Complete Guide About – How to Deploy & Install Rancher on Kubernetes Cluster
Kubecost: Cost Metrics for Running Kubernetes
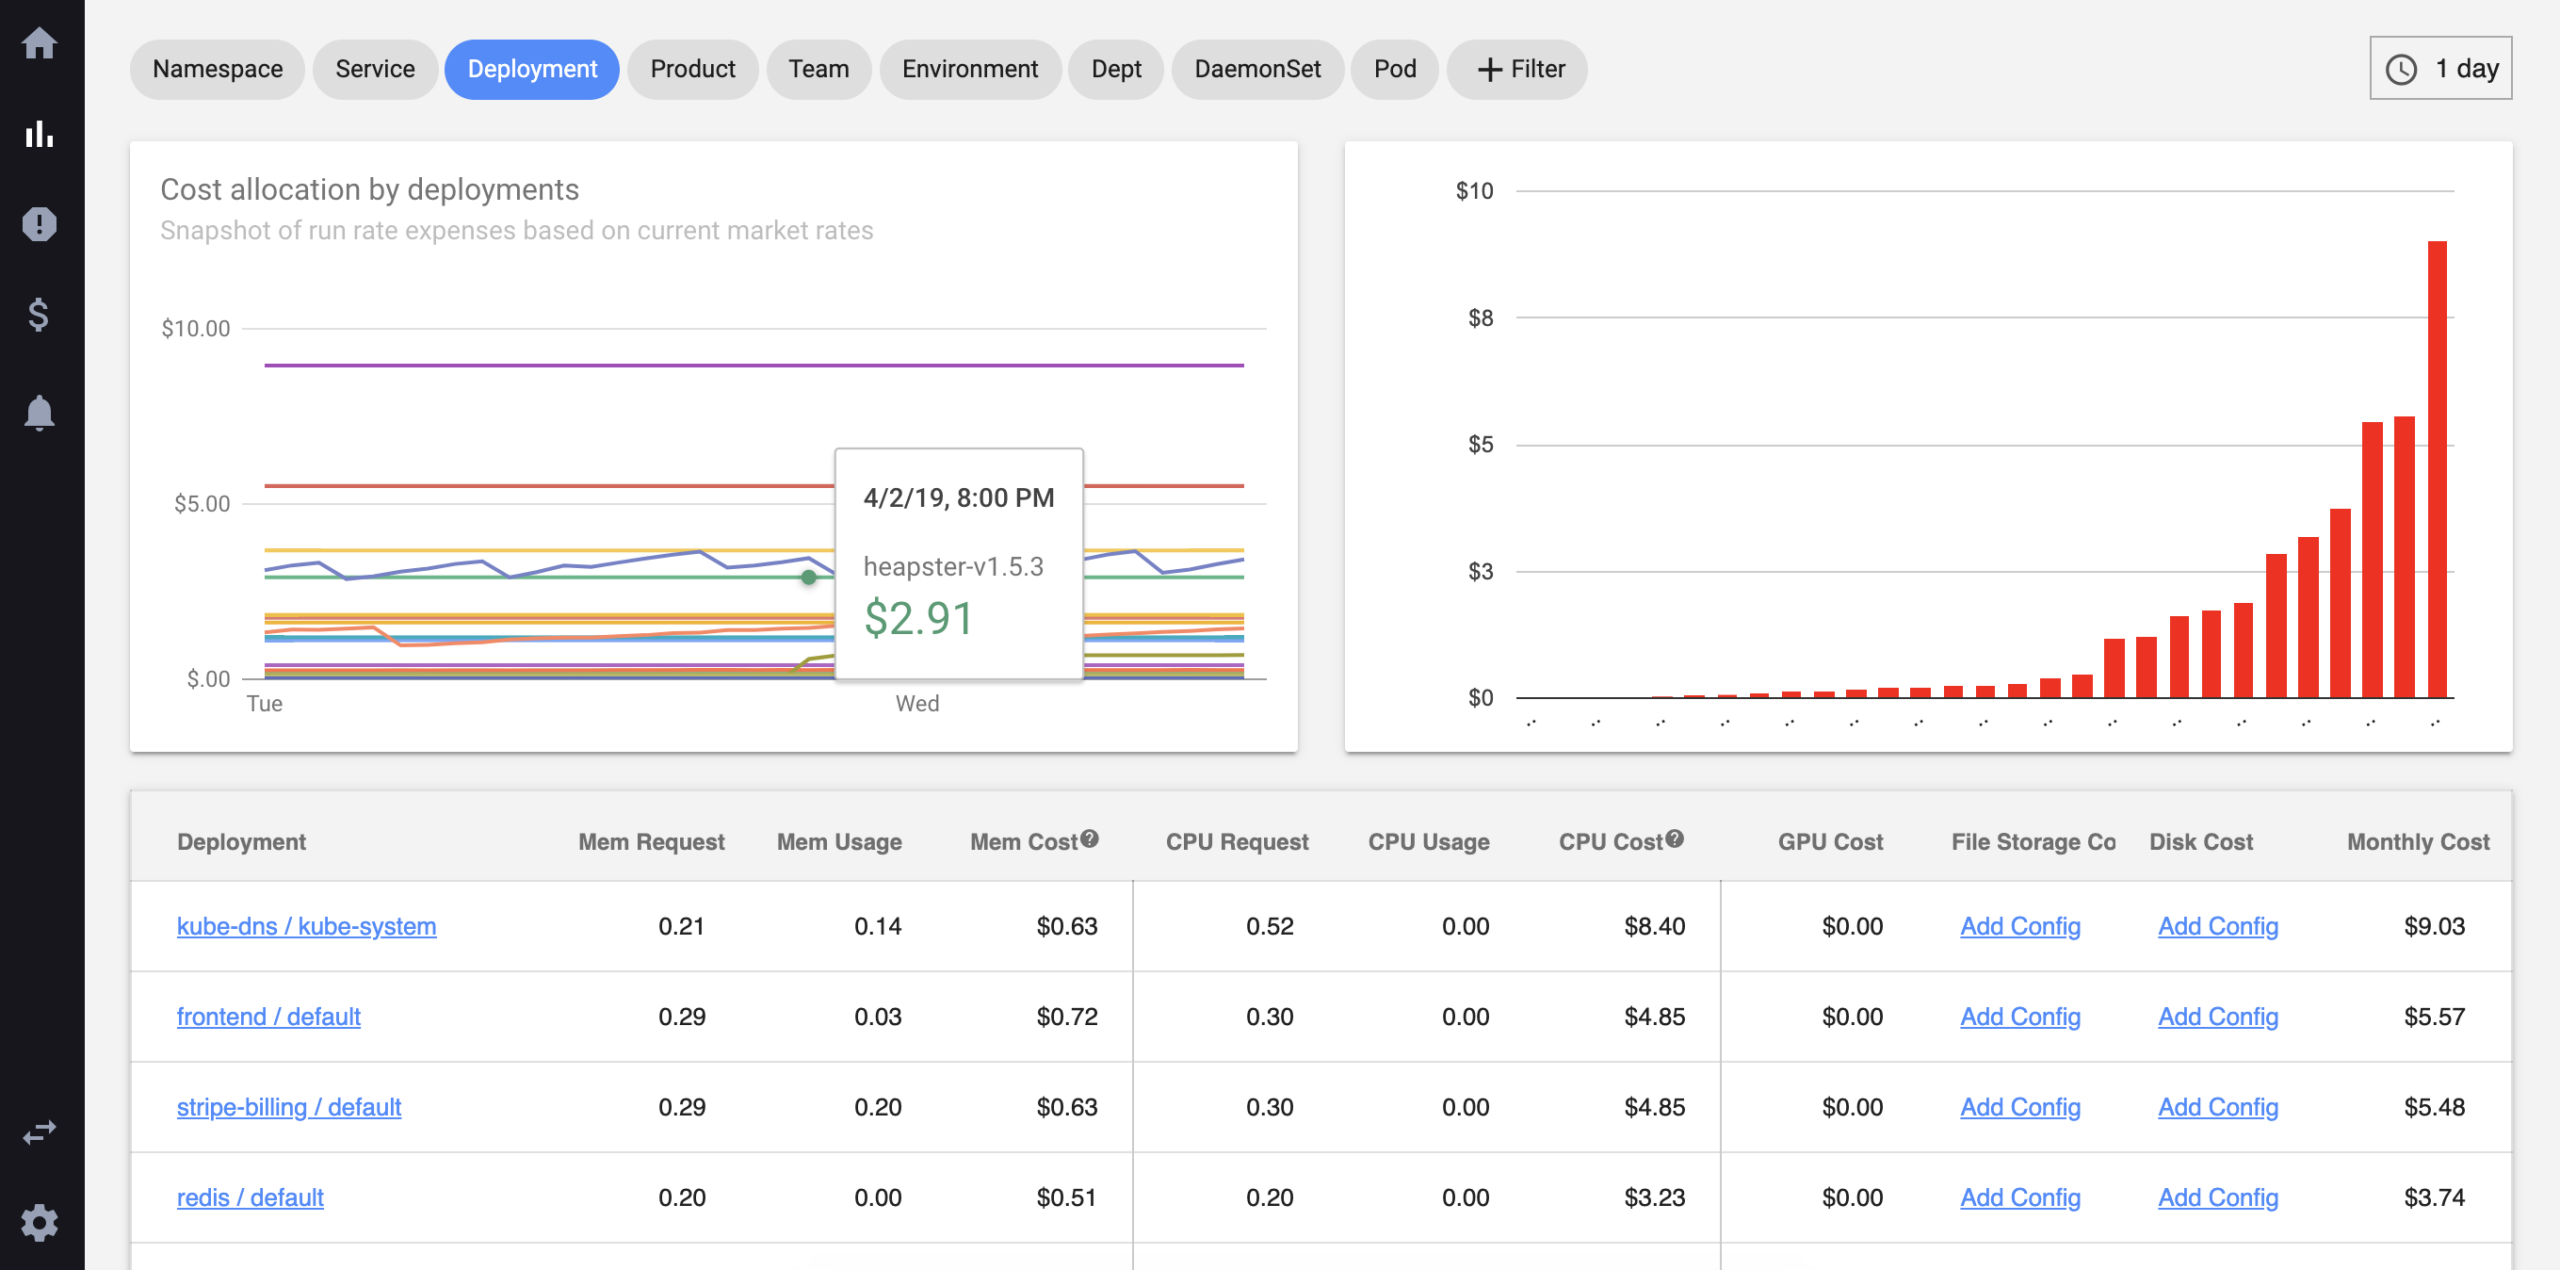
Most of the Kubernetes administration tools focus on ease of use, monitoring, understanding pod behaviors, and the like. But what about monitoring the costs associated with running Kubernetes?
Kubecost is a Kubernetes cluster monitoring tool that uses real-time Kubernetes metrics – and actual cost information – obtained from running clusters across major cloud providers to provide a dashboard view of the monthly cost of each cluster deployment. Memory, CPU, GPU, and storage costs are broken down by Kubernetes components (container, pod, service, deployment, etc.).
Kubecost can also track costs for “off-cluster” resources, such as Amazon S3 buckets, although this is currently limited to AWS. Cost data can even be shared with Prometheus, so you can use the data to programmatically alter cluster behavior.
Kubecost is free for 15 days of registration. If you need more advanced features, the price starts at $ 199 per month to monitor 50 nodes.
Grafana: Data Visualization of Open Source IT Monitoring

Grafana is an open-source platform tailored for the monitoring, analysis and visualization of IT metrics. It is delivered with a web server (written in Go) allowing access to it via an HTTP API. Under the Apache 2.02 license, Grafana generates its charts and dashboards from time-series databases such as Graphite, InfluxDB, or OpenTSDB. This platform is also an essential tool for creating alerts.
A true publisher of computer dashboards, Grafana also allows them to be shared in the form of a snapshot (or snapshots) with other users. The tool also integrates an access rights management system and protects the dashboards from accidental modifications.
You can create as many dashboards as you want on Grafana. This exposes in these dashboards the raw or aggregated metrics coming from the time series databases, by simply defining alert thresholds and associated actions.
Kubelet: insight into your cluster’s current health
In a Kubernetes cluster, Kubelet acts as a bridge between the master and the nodes. This is the primary node agent that runs on each node and manages a set of pods.
Kubelet monitors PodSpecs through the Kubernetes API server and collects resource usage statistics and the status of pods and events.
Kubelet retrieves usage statistics for individual containers from Docker’s Container Advisor (cAdvisor).
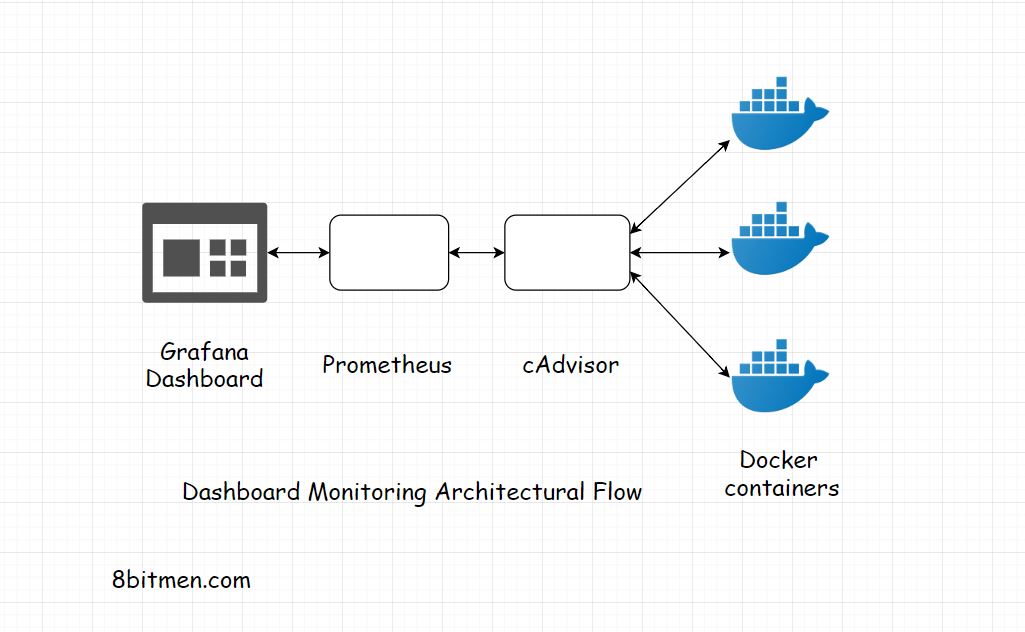
But Kubelet also accepts PodSpecs provided through different mechanisms and ensures that the containers described in these PodSpecs are operational. These aggregated pod resource usage statistics are exposed through a REST API.
cAdvisor: Analyzes Resource Usage and Performance
Google’s response to the container introspection problem is cAdvisor, a tool that is inherently embedded in a Docker container and generates fast, useful information about the basic behavior of running containers.
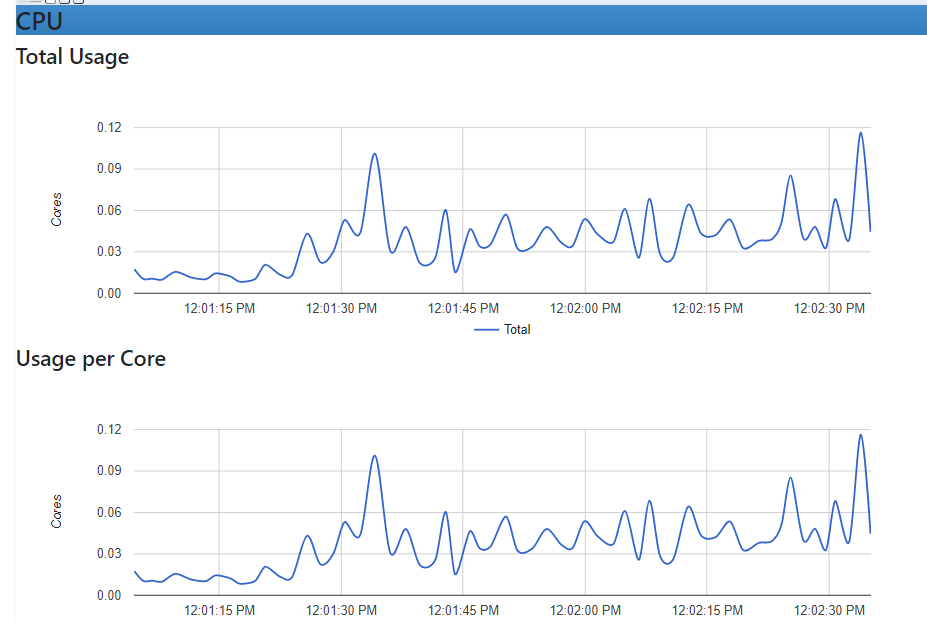
It’s easy to deploy and use, perhaps to the point of error – you can only monitor other containers running on the same host, so it’s less useful for multi-node installations. In addition, any long-term aggregation or distillation of statistics is entirely up to you.
Kedge: Concise Deployment Definitions in Kubernetes
The most common complaint about Kubernetes is the complexity and verbosity of its manifests or application definitions. They struggle to write and maintain, so it’s no wonder people are turning to third-party tools to make things less difficult.
Kedge offers a simpler and more concise syntax. You provide the plain version of the Kubernetes definition file to Kedge, which extends that simple definition to its full equivalent, Kubernetes.
Unlike Koki Short (see below), Kedge does not use the modular syntax for its declaration files. In effect, it simply summarizes application definitions to common shortcuts.
Koki Short: Manageable Kubernetes Manifests
Koki Short – like Kedge above – is a project to improve how application definitions, or manifests, work in Kubernetes. Like the Kedge definitions, the short definitions use an abbreviated syntax to describe Kubernetes modules which can be translated into the full syntax and then vice versa.
Unlike Kedge’s definitions, short definitions are also modular, meaning that details from one brief statement can be reused in others so that many modules with common elements can be succinctly defined.
Kops: Command Line Operations for Kubernetes Clusters
Developed by the Kubernetes team, Kops allows you to manage Kubernetes clusters from the command line. It supports clusters running on AWS and GCE, with VMware vSphere and other environments in preparation. In addition to automating the setup and disassembly process, Kops relies on other types of automation.
For example, it can generate Terraform configurations to allow a cluster to be redeployed using Terraform.
Weaving scope: Troubleshooting & Monitoring for Docker & Kubernetes
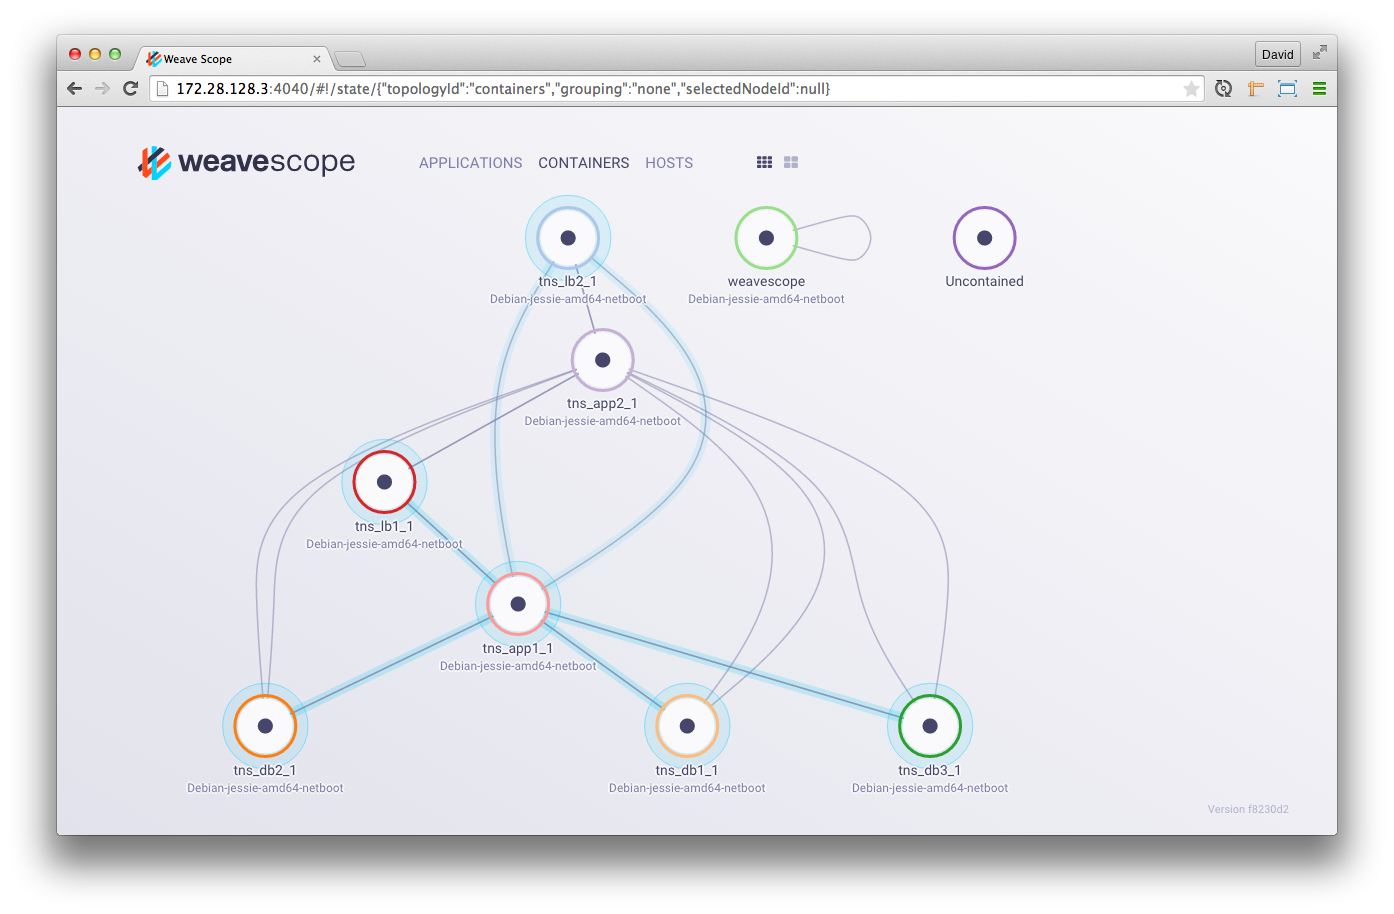
Weave Scope is an unconfigured monitoring tool developed by Weaveworks. It generates a map of the processes, containers, and hosts in a Kubernetes cluster to help understand Docker containers in real-time.
It can also be used to manage containers and run diagnostic commands on containers without leaving the GUI.
If you’re looking for a handy graphical tool to get a visual overview of your Kubernetes cluster, including the application, infrastructure, and connections between your cluster nodes, Weave Scope can help.
Kube-monkey: Chaos Monkey for Kubernetes

A safe way to test a system is to break random things. That’s the theory behind Netflix’s Chaos Monkey, a chaos engineering tool that randomly terminates virtual machines and containers in production to “encourage” developers to build more resilient systems.
Kube-monkey is an implementation of the same basic idea for stress testing Kubernetes clusters. It works by randomly killing Pods in a cluster you’ve specifically designated, and can be adjusted to work in specific time windows.
Kube-ps1: Smart Kubernetes Command Prompt
No, Kube-ps1 is not a first-generation Sony PlayStation emulator for Kubernetes (although it is rather fussy). It is a simple supplementation tool to Bash that displays the current Kubernetes context and namespace in the prompt.
Kube-shell includes this along with many other features, but if all you want is a smarter prompt, Kube-ps1 provides it with little overhead.
The EFK stack: The Elasticsearch, Fluentd, Kibana logging stack
The EFK stack includes Fluentd, Elasticsearch, and Kibana.
These Kubernetes log monitoring tools work well with each other and together represent a reliable solution used for Kubernetes monitoring and log aggregation.
Fluentd collects logs from pods running on cluster nodes, then routes them to a centralized Elasticsearch. Elasticsearch then ingests these logs from Fluentd and stores them in a central location. It is also used to efficiently search for text files.
Kibana is the user interface; users can view logs and metrics collected and create custom dashboards based on queries.
The EFK stack is useful for troubleshooting logs, dashboard, and detecting issues as they arise, all in a user-friendly interface.
Kubespy: real-time monitoring of Kubernetes resources
Pulumi ‘s Kubespy is a diagnostic tool that allows you to track changes to a Kubernetes resource in real-time. You thus have a sort of dashboard with text display.
For example, you can see the changes made to the status of a pod at startup: the definition of the pod being written in Etcd, the pod programmed to run on a node, the Kubelet on the node creating the pod and the pod that is ultimately marked as running. Kubespy can run as a standalone binary or as a plugin for Kubectl.
-
Kubernetes Ingress Controller for AWS
Kubernetes provides external load balancing and network services to a cluster through a service called Ingress. Amazon Web Services provides load balancing functionality. However, it does not automatically couple these services to Kubernetes installations. Kubernetes Ingress Controller for AWS is closing this pod.
Ingress Controller automatically manages AWS resources for each Ingress object in a cluster. It creates load balancers for the new input resources. It removes the load balancers from the deleted resources. And this by using AWS CloudFormation to ensure cluster consistency.
It also automatically manages other elements used in the cluster: SSL certificates and EC2 Auto Scaling groups.
Kube-ops-view: The Dashboard for Multiple Kubernetes Clusters
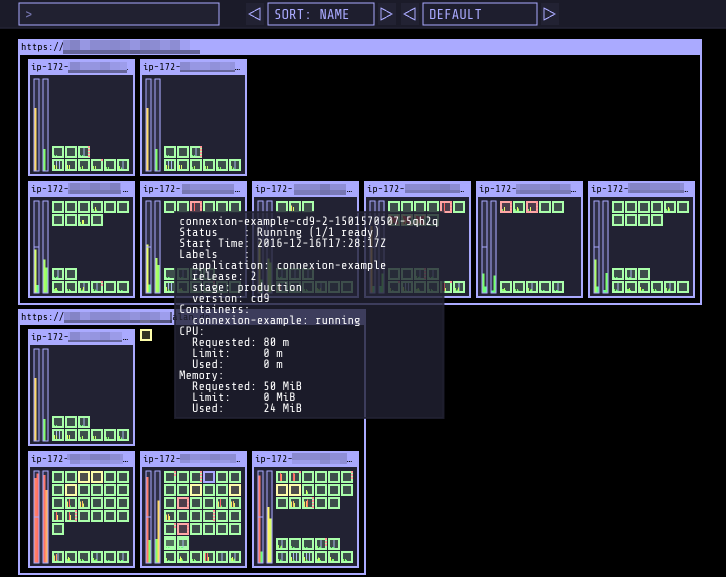
Kubernetes has a useful dashboard for general monitoring. Despite this, the Kubernetes community is experimenting with other ways to present useful data to the Kubernetes administrator. Kube-ops-view is one such experience.
It provides a quick overview of multiple Kubernetes clusters. These are represented graphically, allowing you to see at a glance the use of the processor and the memory, as well as the state of the modules of a cluster.
Note that this does not allow you to invoke commands; it is strictly for viewing. But, the visualizations it provides are striking and effective: they are designed for a wall monitor in your operations center.
Jaeger: Monitoring and Troubleshooting Microservices-Based Distributed Systems
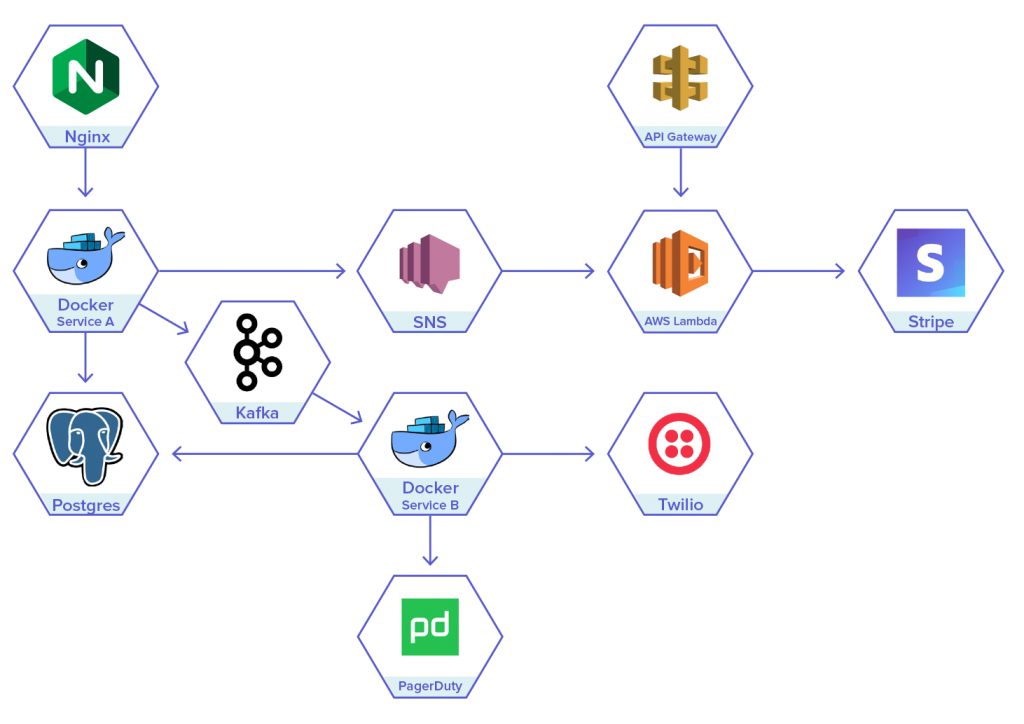
Jaeger is a tracking system published by Uber Technologies; it is used for troubleshooting and monitoring transactions in complex distributed systems.
With the rise of microservices and distributed systems, issues can include distributed context propagation, distributed transaction monitoring, and latency optimization. Jaeger addresses these and other issues we can find in distributed systems.
Jaeger has native support for OpenTracing and addresses two main areas: networking and observability.
Stern and Kubetail: Logbook for Kubernetes

Stern allows you to produce color-coded output (according to the tail command ) from pods and containers in Kubernetes. It’s a quick way to channel all the outputs of multiple resources. This channeling is done in a single stream that can be read at a glance. At the same time, you have a quick way (color-coded) to distinguish the streams.
Likewise, Kubetail bundles logs from multiple pods into one feed, color coding the different pods and containers. But, Kubetail is a Bash script, so it doesn’t require anything more than a shell.
Kubewatch: Monitor Clusters
Kubewatch is a Kubernetes watcher that posts event notifications to a Slack channel. This tool allows you to specify the resources you want to monitor. It is written in Golang and uses a Kubernetes client library to interact with a Kubernetes API server.
Using a simple YAML file, you can choose which resources to monitor, including Daemon Sets, Deployments, Pods, Replica Sets, Replication Controllers, Services, Secrets, and Mappings. configuration.
End Note
Many administrators think they can not draw outside the lines.
Monitoring a distributed system is no easy task, but having a good understanding of Kubernete’s monitoring challenges.
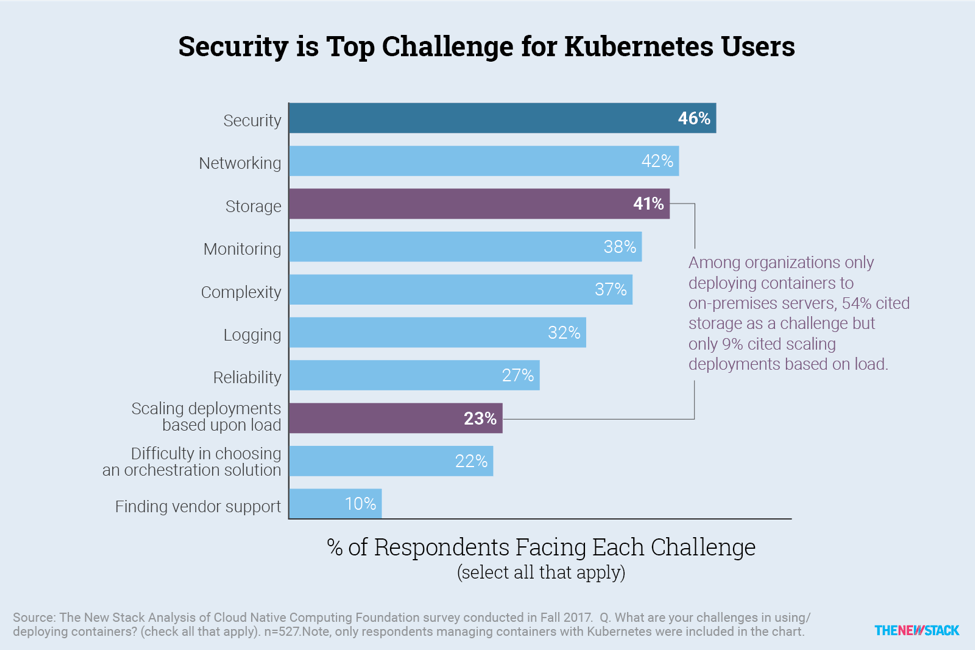
In this article, we’ve covered why it’s important to monitor Kubernetes, the critical metrics you need to track, and the best open source monitoring Tools for Kubernetes available to make your job easier.
All monitoring issues can be handled by this software suite. Installation and configuration are easier than it looks, it only takes an hour or two to read the documentation and mount the system on an environment.
The advantage of using these monitoring tools help us work efficiently with Kubernetes clusters. Get complete observability into your clusters
Further Reading: How to Setup Dynamic NFS Provisioning Server For Kubernetes?

Director of Digital Marketing | NLP Entity SEO Specialist | Data Scientist | Growth Ninja
With more than 15 years of experience, Loveneet Singh is a seasoned digital marketing director, NLP entity SEO specialist, and data scientist. With a passion for all things Google, WordPress, SEO services, web development, and digital marketing, he brings a wealth of knowledge and expertise to every project. Loveneet’s commitment to creating people-first content that aligns with Google’s guidelines ensures that his articles provide a satisfying experience for readers. Stay updated with his insights and strategies to boost your online presence.
